How to use XDEBUG
Modify the Developer CRD
See the list of all available modes.
apiVersion: xrow.com/v2
kind: Developer
....
  env:
    - name: XDEBUG_MODE
      value: debug
...
Setup VSCODE
- start Visual Studio Code
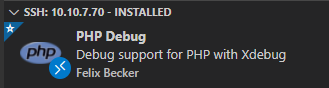
- go to Extensions in the toolbar on the left
- search for PHP Debug by Felix Becker
- click on Install on a remote host
Before actually using Xdebug a few things need to be prepared:
- In VS Code open the file
.vscode/launch.jsonin your project's root directory and edit its content.
{
    "version": "0.2.0",
    "configurations": [
        {
            "name": "Listen for Xdebug",
            "type": "php",
            "request": "launch",
            "port": 9003,
            "stopOnEntry": false
        }
    ]
}
- Decide change
stopOnEntryto true if needed.
Run a debugging session
Keep in mind that you always need to trigger a function if you want to debug it.
- either by reloading the frontend
- or by executing it via terminal if it can't be triggered by refreshing the frontend
Starting a debugging session
- Open a file in the IDE which should be debugged
- Create one or multiple breakpoints by clicking in the beginning of the line which should be investigated
- Go to tab Run and click on Start Debugging
- If necessary select "XDebug" in the new toolbar Listen for Xdebug
- If you use the browser open a URL like
http://192.168.222.2:8080/dashboardto start debugging - If you use the the CLI run a command like
console ibexa:migrations:migrateto start debugging
After this the following scenarios are possible:
- the tool gives a result without doing anything additional
- the tool gives a result only after refreshing the dev-pod's frontend
-
the tool gives a result not until the affected function was called via terminal
-
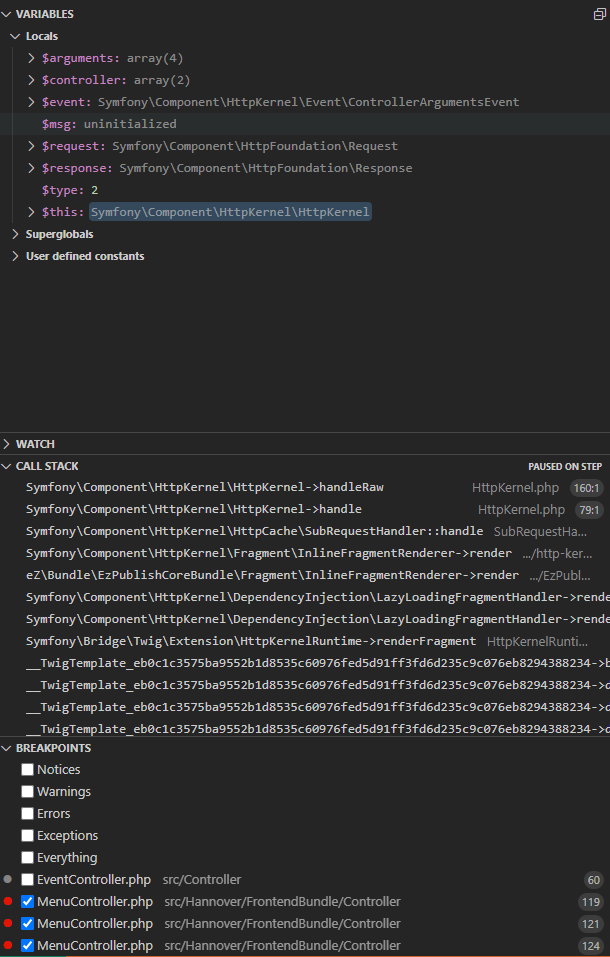
if the breakpoint was reached the results are listed in the menu on the left side
- the first section VARIABLES shows the used variables during the debug call
- the second section CALL STACK shows which classes and functions were used
- the third section BREAKPOINTS allows to filter events
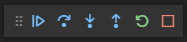
The debugging toolbar
After Xdebug reached a breakpoint different options become available. These options can be found in the Xdebug-Toolbar that appears in VS Code after starting the debug process.
- Continue: navigate to the next breakpoint
- Step Over: jump to the next function/variable/if-statement etc. (breakpoints won't be considered)
- Step In: go inside a statement and jump to the related function that is used
- Step Out: go outside of a statement and jump either to the previous breakpoint or to the overlaying function
- Restart: start the debug process from the beginning (first breakpoint)
- Stop: end the debug process and close the toolbar